Flow Cytometry Tips: Let the Beads Help Setup Your Experiment
In Flow Cytometry (FCS) assay, the importance of running beads samples (calibration beads or beads in general) is often underestimated. When you ask a FCS technician to execute a test with beads, he/she might first question you by saying, “my machine has just been calibrated”, “I have been working with it for more than 2 years without any problem” or “I see from your data that there is no problem”. It is not entirely the technician’s fault, because if you refer to the website of calibration beads manufacturer, you may probably get a conclusion that “the beads is to be used when there is a big problem”. For example, you can find the following information describing the usage of calibration beads on their webpage.
Use of Rainbow Calibration Particles, 8 peaks (3.0-3.4 µm), is common for the following purposes:
1. Instrument performance verification (linearity) and monitoring
2. Standardization of instrument settings for longitudinal studies
3. Evaluation of new collection optics (e.g. bandpass filters)
1. Instrument performance verification (linearity) and monitoring
2. Standardization of instrument settings for longitudinal studies
3. Evaluation of new collection optics (e.g. bandpass filters)
These applications are correct and these points do conclude what the beads can do. However, the “more info” behind each item is another much longer story, and those explanations are the actual references that both new and experienced researchers shall look into.
What is so special with the beads and why are they considered so important?
The beads have the follow properties that make them valuable:
OK, let us start discussing what roles the beads might play in your experiment.
The beads have the follow properties that make them valuable:
- Each type of beads has defined features, regarding its size, fluorescent intensity, roundness, density, etc.
- In a flow cytometer with given parameter, the beads are always detected with the same signal, according to their features.
- The beads are easily preserved, without loss of their features.
- The beads will not – or not easily forms clog (shake before use!).
OK, let us start discussing what roles the beads might play in your experiment.
1. Use beads to find the right gate for new sample
The biological samples are fragile and unstable. After long process or treatment and staining, the signal on the flow cytometer interface may be different from reported/early experience. Some special treatment may even causes the cell death or cell shrinkage/expansion. It will lead to difficulty in finding the correct cell population.
Unlike your test samples, the beads are fixed in size, fluorescent density and shape. Therefore the beads can serve as a control, to let you know that “Hey, I am here, do you see me?”, “Hey, this FCS machine found me” or “Hey, when you find me then bring your sample in”. Initial you experiment with beads and your test sample, by doing so it will be very easy “to gate” the correct population.
Here are some examples of beads usage to set the correct gates.
Example 1-1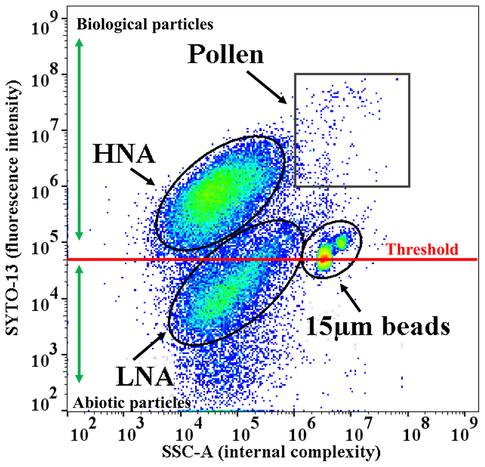
A group of scientists (Negron et al., 2020) is studying the primary biological aerosol particles (PBAP) in the atmosphere and its influence on human health. The PBAP can be divided into these groups: high nucleic acid-content particles (HNA), low nucleic acid-content particles (LNA) and pollen. Samples are harvested and stained by SYTO-13 nucleic acid probe. 15 µm polystyrene beads were used in the test to set up threshold, in order to identify the correct group of particles. BD Accuri C6 flow cytometer (BD Bioscience Inc.) was used for flow cytometry.
On the FCS plot above, by taking the beads size and relative fluorescent intensity as reference, we can easily locate every population. Pollen are large size particle (15μm to 200μm) and rich in nucleic acid; HNA and LNA are similar in size but HNA has much more nucleic acid. In any further FCS test, the relative location of each population shall not show significant change otherwise it means that the sample encountered some problem. Please notice: unless mentioned in the manual of the beads, the absolute size of the sample cannot be measured by comparing with beads. Source: Negron, A., DeLeon-Rodriguez, N., Waters, S., Ziemba, L., Anderson, B., Bergin, M., Konstantinidis, K. and Nenes, A., 2020. Using flow cytometry and light-induced fluorescence to characterize the variability and characteristics of bioaerosols in springtime in Metro Atlanta, Georgia. Atmospheric Chemistry and Physics, 20(3), pp.1817-1838. |
Example 1-2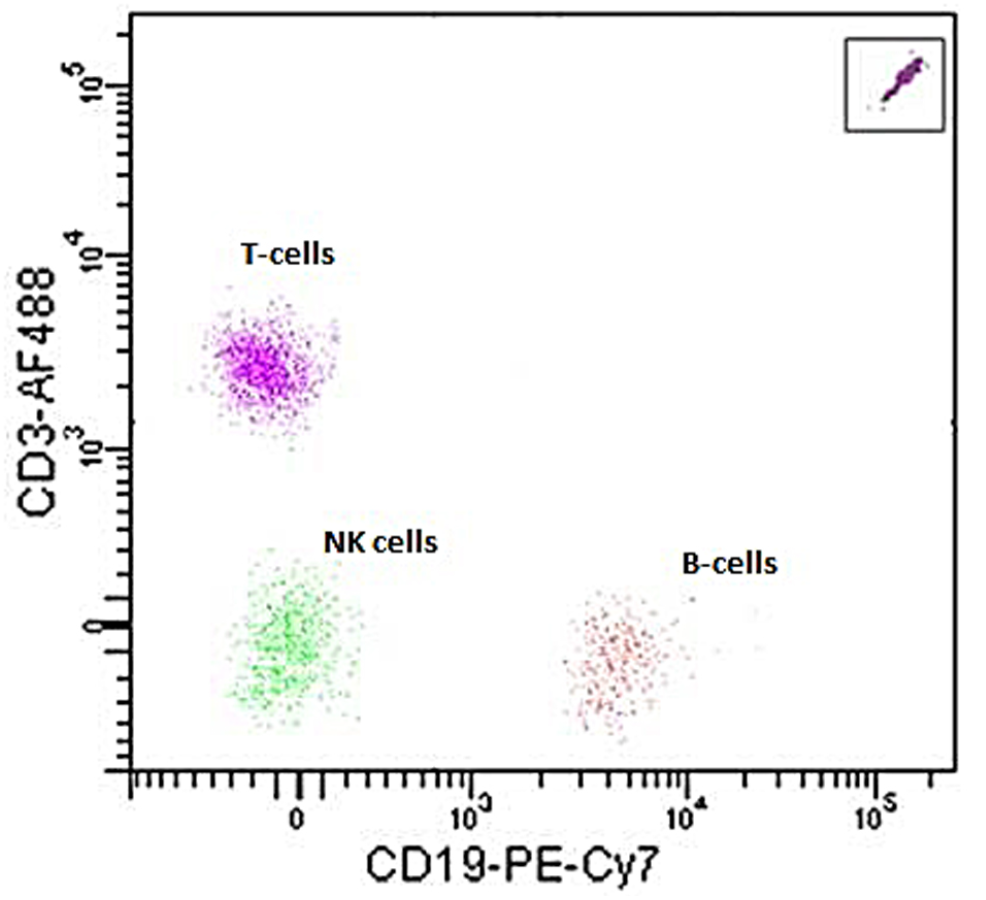
Another example is from PBMCs cell grouping. Isolating PBMCs is simple for experienced labs. However, for researchers who occasionally study PBMCs, the isolation process can drive them crazy. Your sample may have passed many hands before you; you are using some reagent which the functionality is unsure; or simply you are not sure how to gate the right population on the plot. It is time to use the beads to guide you through!
CountBright™ Plus Absolute Counting Beads is from Thermofisher (Catalog number: C36995). It comes with 2 types of size, either 4µm or 7µm. They both have broad range of excitation and emission, which makes them compatible with variable reagent. CD13 and CD19 antibodies are used for staining the sample. From the CD19 to CD3 plot, we see that each population has its relative location determined according to the beads (which is located in the right up corner). Among several routine tests, the relative location shall not change, unless any experiment condition change or some problem occurs to the sample. Refer to the instruction of CountBright™ Plus Absolute Counting Beads (Catalog number: C36995), it is possible to achieve absolute cell counting. We may also calculate the cell counts of each group and take the data as reference for further studies. |
Example 1-3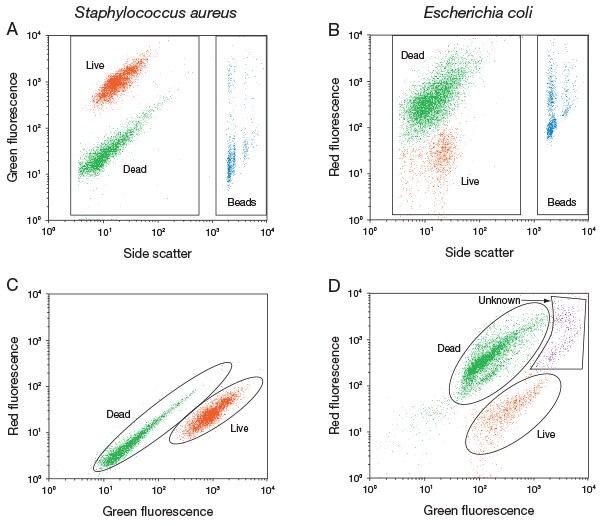
Similar to example 2, another product LIVE/DEAD™ BacLight™ Bacterial Viability and Counting Kit (Catalog number: L34856) is used for bacteria assay in a Flow Cytometer. Bacteria is much smaller compared to cells, on flow cytometer it may be difficult to distinguish them from the debris. The beads here again act as a marker for you to find the desired population (see results in the figure above).
|
Example 1-4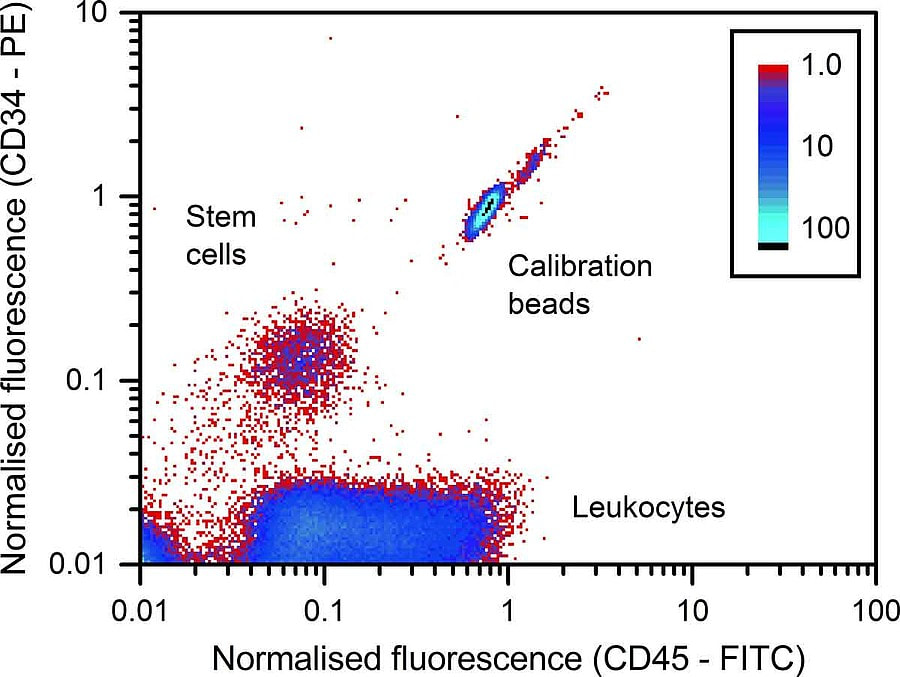
When transplanting stem cells, the dose is a decisive factor. The current protocol is to use flow cytometry to determine the required dose. The image above shows fluorescence scatter diagram for the identification of the CD34-positive stem cells, of the white blood cells (leukocytes) and of the calibration particles that have been added to the sample. By adding beads in the sample, it is easy to identify the correct population of cells.
J. Neukammer, M. Kammel, J. Höckner, A. Kummrow, A. Ruf: Referenzverfahren zur Messung von Stammzellkonzentrationen. BIOspektrum 21, 294 (2015) |
2. Use beads to observe wrong configuration on Flow Cytometer
Imaging you are in a lab where many researchers share one Flow Cytometer. Not everyone understand the machine as well as you, and you have already suffered problems before. How do you make sure that the machine will run well for your next experiment?
A common answer is “you can run your negative sample to see if the flow cytometer is working well”. However, compare to the unstable and/or precious cell sample, to run the beads is a far more reliable method. The beads is more stable than cells, no matter in size, shape and/or fluorescent intensity. Hence, the beads is cheap and easy to get – you just need to open the fridge and shake the vial then you can use it. The cell samples, sometimes even the negative cell is precious and you probably do not want to waste any of them.
Let us talk further - if a problem really occurs to the flow cytometer and you need to contact the manufacturer, the first test demanded by the technical support will probably be beads test. It is not about “you do not trust my sample”, instead it is to say that different cell samples are very diverse and it is hard to identify the problem.
Here let us see how the beads can test the wrong configuration of the flow cytometer.
Example 2-1Hereunder, the image on the left is showing a good liquid flow system; while the image on the right is showing either some cell clog in the fluidic system, or flow failure. In this case, no researcher will be happy to use their precious sample for the test.
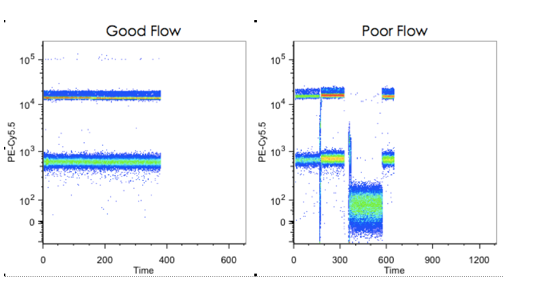
Let the beads do the checkup work! You may inject beads sample and check the stability of the run. Plot a time vs a scatter plot to see how even the flow was during the run. If the plot is showing the image on the right, a cleaning may be needed or you have to contact the aftersales service.
(Source: Cheeky Scientist LLC.) |
Example 2-2The change of emission light power may occur with different reasons. On some models of the flow cytometer, the changeable emission power is part of its function; or sometimes simply the laser system problem causes the change of emission power. The unexpected change of emission power is hard to be discovered by running cell sample, and the beads has to be run to test the system.
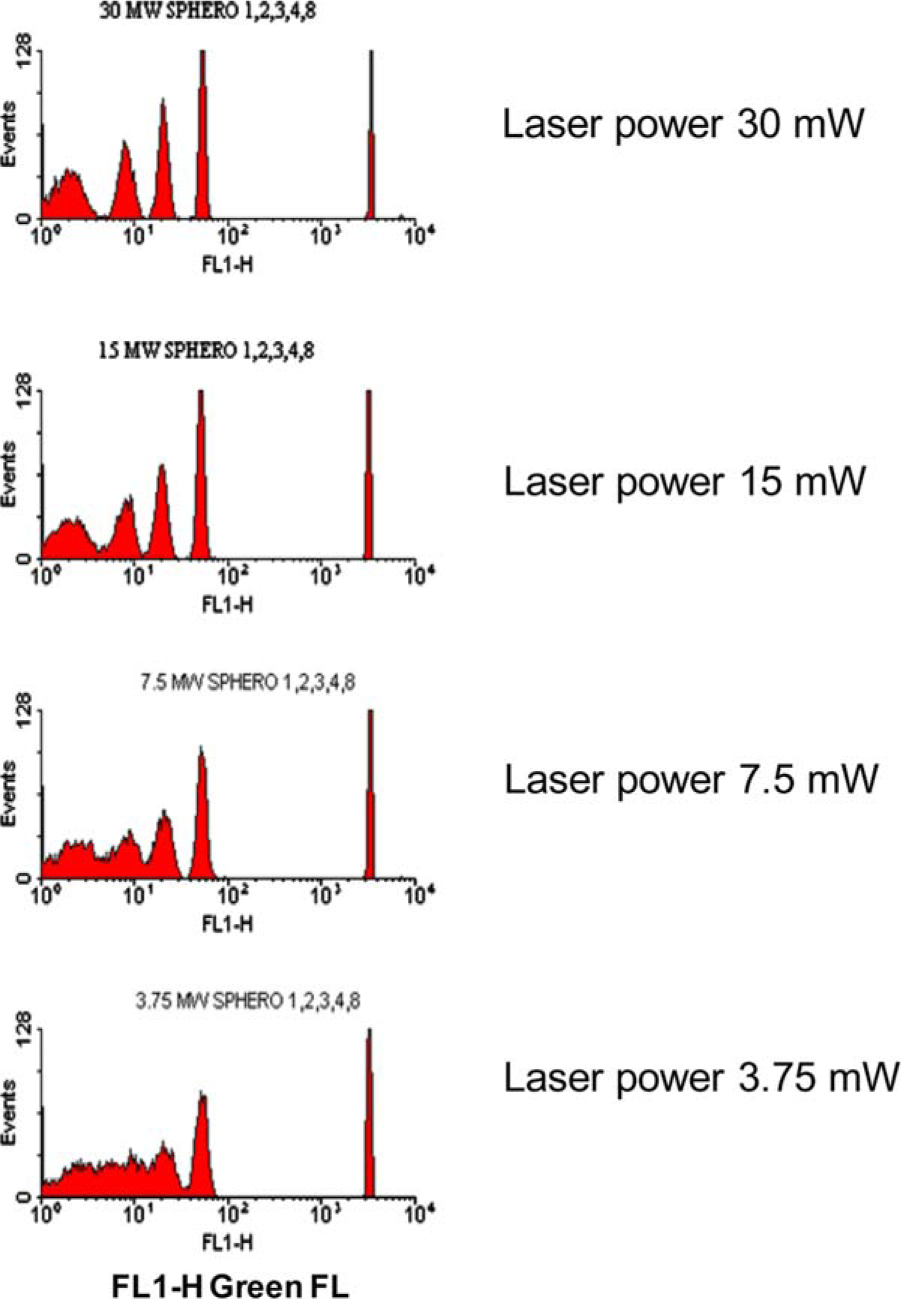
Rainbow beads from Spherotech (author did not mention the catalog number) injected into a cytometer with different emission power (author did not mention the model of the machine). Emission power is 3.75mW, 7.5mW, 15mW and 30mW separately. The most left peak (the dimmest population) is a group of unstained, autofluorescent beads.
The result reveals that when the emission power going lower, the peaks which indicate lower fluorescent intensity starting to overlap with each other. When the laser power drops to 3.75mW, peak 1, 2 and 3 merged into a plateau and can never be identified. It forms a critical situation in cell research, as the cell samples vary and it often happens that the stained sample has low fluorescent intensity. In order to avoid any unexpected result, you may run the beads ahead of your sample to check the machine. Source: S Tanqri, H Vall, D Kaplan, etc. Validation of Cell-based Fluorescence Assays: Practice Guidelines from the ICSH and ICCS – Part III – Analytical Issues. Cytometry Part B (Clinical Cytometry) 84B:291–308 (2013) |
3. Use beads as sample marker (or well marker)
When running FCS assay on a 96-well or 384-well plate, it is also a good idea to use the bead to help you identify different samples. Some types of flow cytometers already has built-in software compatible with the “beads marker” methodology. Please be noticed that “sample marker” method may not be suitable for all of the flow cytometers, such as some types of machine that create a single file for each well.
Why using beads as sample marker? Some wells may be missing, due to plenty of reasons like the liquid in the well is too low, cells sticking to the well, sample stuck in the fluid system, or simply your experiment does not contain a lot of cells. It might also happen that a well over lapped with next well on the graph. The latter may be due to the high density of cells or cells form large clog in the fluidic system.
The beads may serve as a good reference to determine different samples among the wells. “Between well marker” – as defined according to the manufacturer, is located together with the 96-well plate. Each time after the sample was injected, the sampler will take the beads to inject in the fluidic system. Then we selected Time-Events graph and the result will be shown as below.
Example 3-1
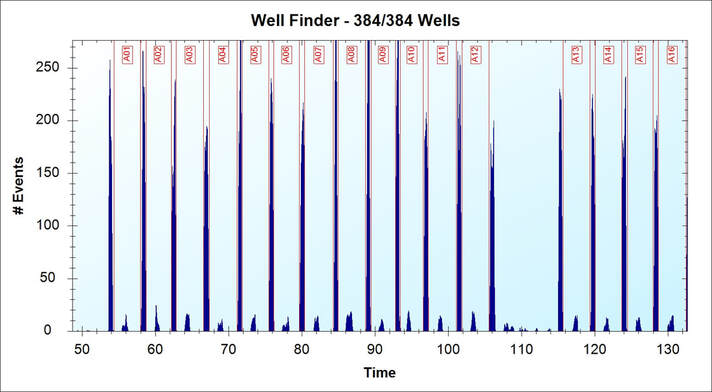
Solubility study for compound is a very important validation in drug discovery that should be done before biological test. The insoluble or low solubility compounds will form particles in the solution and may cause false negatives result, because the real concentration of the compound in the assay is less than designed. This application is designed to test the compound sample through flow cytometer and “between well marker” is used to identify each sample. Source: Intellicyt INC. (now part of Sartorius)
After the plate and marker were read by the flow cytometer, we will see the Time-Events graph above and the build-in software automatically separated each sample. The high peaks are the “between well marker” and the low peaks are samples. For your specific experiment, you may also try the method and it will make you daily work much more efficient.
Further result related to the application, please refer to the website of the manufacturer.
Conclusion:
- Flow cytometer is a complexed machine which is composed of fluidic system, laser system, detection system and analyzing system. Any malfunction will lead to strange result.
- Beads have fixed performance on each machine, it is a reliable control for your experiment. Even as a beginner, you can use the bead to learn “how to use the flow cytometer”.
- For any new sample or experiment, it is a good idea to initialize the test together with beads.